Thursday, December 13, 2018

Image of the Day: Himalayans Glacier retreat 1989-2015


This pair of Landsat images has compared the Ngoyzumpa Glacier located in Nepal Himalayas in 1989 and 2015. It shows that the supraglacial lakes on the glacier surface (melting ponds) have increased in amount and in size from 1989 to 2015. This reveals that with the global warming and rising temperature, the melting speed of glacier has increased. This pair of images serves as a good evidence for global warming and glacier retreat and help researcher investigate the glacier condition in the Himalayas, as the melting glacier and lakes might affect the agriculture and local residents in this area.

https://landsat.visibleearth.nasa.gov/view.php?id=90185

Thursday, December 6, 2018

Mars from 10,900 Miles Away on November 26, 2018

MarCO-B, one of the experimental Mars Cube One (MarCO) CubeSats, took this image of Mars from about 10,900 miles (17,500 kilometers) away just after NASA’s InSight spacecraft landed on Mars on Nov. 26, 2018.

This is an image of Mars from 10,900 miles away, captured on November 26, 2018 by NASA’s satellite Mars Cube One (MarCO). In the image you can see the reddish-brown sphere of mars soaking up the sun, all of which is framed by components of the satellite. Besides for simply being a beautiful image, I thought this was relevant considering it was captured the day NASA landed their most recent Mars rover InSight. InSight itself will surely bring some amazing remote sensing images in the near future!

Barrio Obrero, Puerto Rico April 2018


        This image shows the devastation left by Hurricane Maria in Puerto Rico in September 2017. The blue tarps on the top of houses were used as temporary solutions until the houses could be repaired properly. However, the date of this image is April 2018, almost eight months after the hurricane and they still haven’t been fully fixed. The image is a true color composite and shows how remote sensing can be a powerful tool to observe and assess damage repairs in large-scales areas. In this image we can see how slow the reconstruction process for Puerto Rico has been.

https://earthobservatory.nasa.gov/images/92789/recovering-from-hurricane-maria

Tuesday, December 4, 2018

Image of the Day


For my image of the day, I found a very interesting article from the New York Times on one of the reasons on how China became a superpower. The article explains how China controls the energy consumption of many of the countries around it, and Cambodia is one of those countries. This image shows the Kamchay dam in Cambodia. The deep blue water is in stark contrast with the eroded landscape below it. The dam seems to be located in a non-urban setting, with a landscape consisting of sparse forest and grassy area surrounding it. The river does not seem to be flowing much past the dam, which could effect the ecosystem of the area that once relied on the river. This image is important because it symbolizes the reliance countries like Cambodia have on China. According to the article, China has paid for the construction of 7 dams in Cambodia alone that generate over half of the countries electricity. This leaves Cambodia indebted to China, without the consistent running of the dams by their large neighbor to the north, their country could come to a screeching halt. 

Image of the Day: Eye of the Sahara


This image displays the Richat Structure located in the Saharan nation of Mauritania. Sometimes called the "Eye of the Sahara", and claimed to be proof of the Lost City of Atlantis this structure was once though to be an impact crater. After many years of confusion surrounding it, the Richat Structure was determined to be the eroded remnants of a geologic dome. Although not completely understood, the use of remote sensing technologies may hold the key to solving the mysteries surrounding this bizarre geologic feature.

"Sand Sea" in Arabian Peninsula


The image is dating back to 2005 and was captured by ASTER sensor of Terra satellite. The so called "Sand Sea" in the image is taken in Rub' al Khali desert in Oman, on Arabian Peninsula. Due to high reflection from the parts between the dunes, the landscape seems so "wavy", while the highly reflected areas are just the flat plains that are left here after the shallow lakes present in the area many thousands of years ago dried up. The desert is mostly dry, having just 3.5 cm of precipitation yearly, however, this year in spring-summer season it rained heavily (tropical cyclone Mekunu) and the precipitation level raised up to 28 cm for 2018. The importance of the periodic satellite imagery of a region is that they allow us to evaluate the change in natural landscapes, and estimate its effect on related fields (e.g.rise in vegetation, that could serve as a food source for local camels).

Monday, December 3, 2018

Forest Fires


This image is from the late 2017 wildfires in California. I was inspired to look for images of wildfires because of their recent wildfires, but this one was more interesting to me than recent images available. In the image you can see a very strong contrast between burned, which is different shades of brown and spared land, which is mostly green areas, as well as land that is currently burning, designated by the orange flames. Along with the orange flames, there are trials of white/grey smoke leading to the source. There was so much burning in this area that a large section of the image is covered by smoke.

Wednesday, November 28, 2018

Wildfires Continue to Rage in California

http://blogs.discovermagazine.com/imageo/files/2018/11/campfire_oli_2018312_crop.jpg

This Landsat 8 image displays wildfire continuing to set the Sierra Nevada ablaze at 10:45 AM PST on November 8th, which claimed 6,713 total structures in Paradise, California. The image was produced with a 4-3-2 Landsat image, a combination of visible (red and green) and near-infrared light, to bring out active areas of the fire. Called the Camp Fire, this fire began at 6:30 AM and had destroyed over 100,000 acres of land in the next two days. The image does an admirable job showing the direction of the fire, with the cusp of it very clearly seen on the top-right of the image, and the wind can be seen blowing smoke and ash to the bottom-left. Since the image was taken in the earlier part of the fire's wrath, its long-term damage to the area is still obscured by smoke, and much of the damage had not even happened yet. Nonetheless, the vivid contrast between the bright red and orange flames and surrounding green forestry is quite stunning.

Thursday, November 15, 2018

Debris Off of the Coast


This satellite image taken by the Landsat 8  satellite shows debris runoff into the Atlantic Ocean off of the coast of North Carolina after Hurricane Florence. When looking at the bodies of water in the image inland they all look to be bordered closely by uniformly pattered developed areas. This is indicative of heavy flooding in the area that washed large quantities of debris into these rivers after the hurricane. Looking at the ocean water near the shore there is a much darker discoloration compared to more open-water areas, with the darkest water occurring where the flooded rivers enter the Atlantic Ocean. The gradient of coloration shows the diffusion of debris that washed into rivers into the Atlantic Ocean which looks to take up most of the image. This satellite image is particularly jarring as the large scope of the debris washing into the ocean after the hurricane is visible.

Wednesday, November 14, 2018

Metaphor for Reality


This image was taken from the ISS by an astronaut. It shows a coffin shaped ice-berg named BT-15 migrating to the "Ice-Berg Graveyard". This graveyard has been named since as ice flows into this region of the ocean, ocean currents rapidly warm the water and ice begins to melt, "killing" ice-burgs. The fact that it is a coffin adds to the "morbid reality" and also a metaphor for our volatile climate change. 

Monday, November 12, 2018

Image of the Day, November 13th

This image is showing a dust storm in Greenland captured by the Sentinel-2 satellite. The region being photographed is located about 80 miles northwest of the village Ittoqqortoormiit in Greenland. It’s astonishing that there is a dust storm as the region in the image is at 73 degrees North, or 700 miles north of the arctic circle. The dust is coming from the bedrock which is scrapped down by moving glaciers then being picked up by high winds. The dust storm came about due to the drying of a braided river and an aggressive northwestern wind. According to the NASA scientist who publicized this event, this is the largest dust storm seen this far north in his memory.

Thursday, November 8, 2018

Meandering Goosenecks in Utah


This image is depicting a Southeastern region in Utah, where a meandering stream makes very sharp and curved bends around the surrounding valleys known as goosenecks. It is for that reason that this region is a part of the Goosenecks State Park in Utah. These are most often formed by a stream or river that moves from opposite sides across its floodplain, which then erodes the sediments, forming a cut bank. This then deposits other sediment downstream onto a point bar and forms the meandering stream shown above. This image may be important as it helps show what happens to rivers when they are faced with a slow flow and are forced to alternate between high and low elevation points in a tilted flood plain valley such as the one in Utah.

Carbon Dioxide Frost on Mars


The image of the day for November 8th is a satellite image from the Mars Reconnaissance Orbiter. Through the HiRISE sensor, the MRO is able to capture visible light with a resolution of 1m. The image captures a rust colored crater covered with CO2 frost from the Martian atmosphere. During the spring, frost only remains on the slopes of the craters that are facing south. As the frost melts the rising gas brings dark colored sand from lower levels of the soil, leaving a banded appearance at the surface.

Sunday, November 4, 2018

World's largest offshore wind farm

At first glance, it appears to just be a pretty aerial photograph of a water body, but if you look closer, you can see small white dots in an orderly pattern. The image was captured on April 28, 2013 by the Operational Land Imager (OLI) on the Landsat 8 satellite. The image depicts the world’s largest offshore wind farm off the coast of England. In total, the London wind farm array consists of 175 wind turbines each 147 meters tall and spans a distance of 100 square kilometers. It is apparent that the white objects have height due to the shadows visible in the image. The swirling of brown and blue in the image is spring sediment runoff from the Thames River mixing with the North Sea. Some people have become concerned with the impact the wind turbines are having on sediment in the ocean and how the changing sediment transport could alter the underwater ecosystem. If you look closely, in some places the sediment wake pattern is correlated with the wind turbine locations.  

Thursday, November 1, 2018

Image of the day 01/11/18


This is an image of Lake Bogoria in Kenya that was taken using a drone by a Spanish photographer named Cristobal Serrano. In the image, a large group of flamingos feeding in the lake. In addition, the unique combination of a volcanic layer of soil under the topsoil and the dry season has resulted in high concentrations of salts and minerals that created the variety of colors that can be seen in the image.  Visually, the shapes and patterns of the image seem natural but the colors combination is not something we are used to see in a natural environment and that what makes this image special.


Wildfires Destroy Neighborhood in Santa Rosa (10/31/18)

This satellite image shows the damage caused by wildfires (from Oct 2017) in the Coffey Park neighborhood in Santa Rosa, CA. The destroyed homes appear as a continuoushomogenous, group of building remains that take up about half of the spatial extent of the photo. The burned homes have a much lighter tone than the dark roofs on the standing homes. There are homes that evaded the fire surrounding all sides but the north section of the burned homes suggesting that the fire came in from the north. According to an analysis of the satellite images from Santa Rosa by The New York Times, about 1,800 buildings were destroyed by the wildfires which was three times higher than the estimate officials had made earlier. This photo shows about 1,300 of those destroyed buildings in the Coffey Park neighborhood alone. This image and its analysis were important in visualizing and providing a more accurate estimation of the extent of the damage caused by the wildfires, something that was not accomplished as well without the aid of satellite imagery
https://www.nytimes.com/interactive/2017/10/12/us/santa-rosa-california-fires-damage.html 

Thursday, October 25, 2018

Image of the Day: October 30, 2018


This is a vertical image of the Aral Sea, which lies on the border between Kazakhstan and Uzbekistan. The Aral sea was once the 4th largest lake in the world, and was roughly half the size of Great Britain. Since the 1960's the sea has been shrinking due to local irrigation projects that diverted inflows, and it is now a small fraction of its formal size.

Tuesday, October 23, 2018

South Bay Salt Ponds, 10/24


This oblique photo captures the South Bay salt pond complex of the San Fransisco Bay. Going back over a hundred years, these pools were created for salt production by dredging and filling the naturally occurring salt marshes and wetlands of the Bay Area. The varying colors of the ponds indicate different stages of the evaporation process. The red coloration is indicative of higher salt concentration/greater evaporation, with the color itself caused by the presence of algae, microbes, and brine shrimp that thrive in this high-salinity environment. These salt ponds are now the site of an extensive environmental restoration project to convert the land back to natural wildlife habitat. 

Tuesday, October 16, 2018

Image of the Day


The Landsat-5 image shows Lake Erie and a small portion of Lake St. Clair enveloped in a harmful algae bloom in 2011. The fluorescent green swirls in the lake are mats of cyanobacteria, and the high levels of agriculture and urbanization around the lake offer a clue as to why the algae bloom is happening in the first place. Imaging algae blooms like this one is important for quantifying the bloom and for analyzing the success or failure of management efforts on the lake. Harmful algae blooms have devastating negative effects on lakes like Lake Erie and are an increasing cause for concern with increased human activity and climate change.

The Devastation of Palu, Indonesia


This image shows the city of Palu, Indonesia before and after the 7.5 magnitude earthquake and subsequent tsunami that occurred on September 28th. Exemplifying the impact of this disaster, we see the drastically increased sediment load washing out of the river. This is identified by the shift in the water color from brownish-blue to a distinct earthen-brown. Comparing the coastline in the two images, large swaths of beach and structures have completely disappeared. Upon closer look, the bridge at the mouth of the river has either collapsed or is flooded, which has implications on access to emergency services and transportation. Along the perimeter of the city there are also clear signs of landslides; where buildings once stood we now only see brown earth. While this image does not give an on the ground look of the devastation individuals are facing in the wake of this disaster, it is important because it gives us a larger city-wide view of the destruction. The large plume of sediment washing away also has implications for the state of the landscape in areas not included in this image, further upstream.

A Smoky Situation, 9/24/18


The Pacific Northwest experienced another intense wildfire season. This photo was taken on August 15, 2018 where a large smoke-cloud is hovering over eastern Canada. Although there are numerous white or normal-looking clouds in the satellite imagery, the wildfire smoke is distinguishable by it's gray tone and its dense appearance versus the clumps and wisps of normal clouds. Analyzing the size of this smoke cloud can define a region and area of people who will be affected by poor air quality from the smoke. Poor air quality is threatening to those with asthma and heart conditions because the contaminated air impedes one's lungs. Sometimes, poor air quality can be a threat to the average person because of how the contaminated air reduces lung function. This is how it was for many during this August's wildfires as the government of British Columbia called for a state of emergency due to the health risks of the smoke. Analyzing the region most affected by this accumulation of smoke is important because citizens can be warned to take precaution for their health. This could potentially reduce the instances of asthma attacks or heart-related emergencies during wildfire season by advising people to exercise indoors or reduce time outside for the time being. Analyzing remote sensing images like this may be used as preventative efforts in public health.

http://blogs.discovermagazine.com/imageo/2018/08/16/smokey-superlatives-widespread-wildfire-impacts-seen-from-as-far-away-as-a-million-miles/#.W6sT5y2ZNol

Image of the Day October 16th

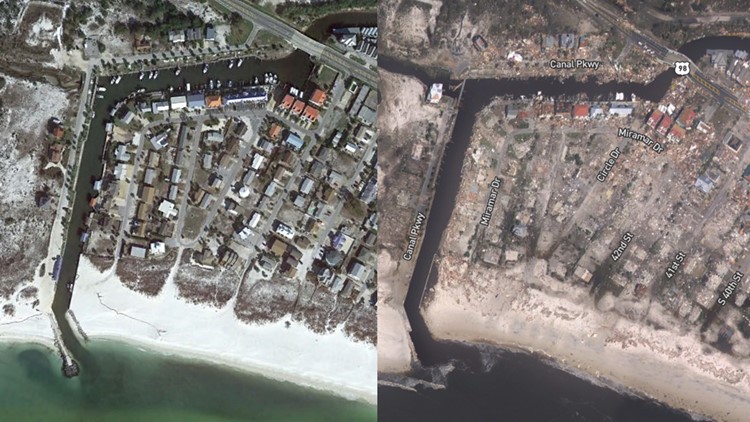
Mexico beach new before after 10 11 18
This is an image provided by Google Earth of Mexico Beach, FL before Hurricane Michael and an image provided by the National Oceanic and Atmospheric Administration of Mexico Beach after Hurricane Michael.  The destruction is clear in this image with the contrast of the clear lines of roads and buildings on the left, and the speckled rubble on the right.  Street names have to be used as labels in the image on the right to provide context to where the streets once were.  The breakwater at the end of the canal is gone in the image on the right and the sediment deposition is drastically changed as a result of the storm surge.  The piers on the left have also been clearly destroyed.  This image was posted in a Pensacola News Journal article, Mexico Beach has already begun recovery efforts.

Thursday, October 11, 2018

Dirty Ice, October 11, 2018


This is an image of the Foxe Basin, up in the Northwestern Passages in northern Canadian, north of the Hudson bay. It seems that the ice has a brownish tint. The reason that this subtle difference is so important is discovering the reason for the brownish tint of the ice. One theory is from anthropogenic sources such as aerosols from industrial factories that have been emitted in the atmosphere and being deposited on the ice. Other sources could include sediment movement in the ocean. So looking at multiple images of the same area at different times and looking at other physical properties of the ice, we can possibly get a better sense of sediment movements in the ocean. 

Image of the day, October 11, 2018


Tuesday, October 9, 2018

Islands in Russian High Arctic, October 9, 2018

This image observed by satellite Landsat 8 displays four islands in Russian high Arctic. Based on the white color , snow texture, ice cubes, the brown mountain-like feature and no presence of vegetation shown in the image, it is a tundra in area of very high latitude. The image is important since it helps scientists do research about different terrains in the world and may be used in studying global warming as in the image, some ice on the border of the island in the lower right place are melting.

Tuesday, October 2, 2018

Image of the Day, October 2, 2018


This image shows the Midwest covered by snow during February of 2014. The Great Lakes are frozen over and drifts can be seen on the lakes where wind blows the snow around over the ice. Wind blowing west to east creates drifts that push the snow across the lake. Less snow is blown onto the lake from land than is pushed across the lake, which is why the west side of the lakes have less snow cover.