Monday, July 8, 2019

Platte, Missouri, and Elkhorn Rivers


This GIF image shows flooding on the Platte, Missouri, and Elkhorn Rivers near Omaha Nebraska. We can see the immediate effects of color change in agriculture and flooding of the river bands into huge areas of land. The two images were taken in late March of 2018 and 2019 respectively, from the Landsat-8 Satellite sourced from NASA Earth Observatory, and edited by Tom Yulsman. 

Trees Affected by Bacteria in Puglia, Italy

https://www.osa-opn.org/opn/media/Images/Homepage/Newsroom/0718/News-3Jul-image1.jpg?width=1200

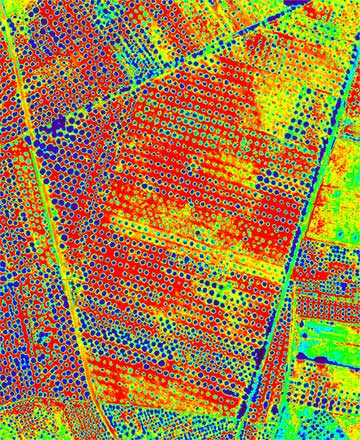
This image is a false color hyper spectral image using blue, red and NIR wavelengths to highlight olive trees in southern Italy affected by a bacteria called Xylella Fastidiosa, with the affected trees shown in brighter colors for the RGB display. This type of imagery is important because it shows one of many cases where different combinations of spectral resolution can help treat crops more quickly before they are lost to a disease or infestation. This technology is applicable to many crop production issues in all parts of the world and can help decrease the use of pesticides to only the areas that are actually affected. This not only improves production and decreases costs, but also does less damage to the surrounding ecology. On a side note this improvement in production could be a crucial part to feeding the ever growing human population on earth. The image was taken using a camera flown 500m above the ground, and was edited by Pablo J. Zarco-Tejada.


Image of the Day

        This is the Isle de Jean Charles, in Louisiana. A community belonging to the Biloxi-Chitimacha-Choctaw nation, it was settled in the early 1800s and grew rapidly in size after the Indian Removal Act went into effect. Miss management of dredging operations and canal creation starting in the 1920s was the beginning of the end for this small island. Since about 1950 the isle has reduced in size by nearly 98% and the population has dwindled from more than 350 to less than 75 people. The entire ecosystem has been destroyed and as has their economy, ancestral lands, and way of life. In 1998, it was determined that it was not cost-effective to include the island in the Gulf Flood Protection system and the one road to and from the island will no longer be repaired. This road floods if tides are higher than normal, any time there is a storm/hurricane in the gulf or if the wind blows from the southeast. The community is currently in the process of relocating and are considered to be the first climate refugees in the world. At one point in time, the island was more than five miles wide, with large trees and abundant fishing, what remains is about ¼ mile across and 2 miles long and most of the wildlife is gone. The images show the textural change as the land is swallowed by the water through the passage of time. I put them in a clockwise order starting from the top left so that the earliest and latest images would be easy to compare. The 1990 image gives clear pictures of the canals that were cut by oil companies, comparing these lines through the images also shows that these man-made structures are unable to withstand the damage of rising waters and the degradation they themselves have caused. It can be seen through the pictures how much of the vegetative cover has changed between 1963 and 2019, however, consider the real damage started in the 1950’s so even the 1963 photo is not a real representation of the overall change and loss. One especially distinct feature that changes a great deal through the photos is the canal that zig-zags through the top right side of the pictures. What was once a very distinctive feature in 1963 and 1990, is almost completely gone in 2019. These images are important because they document the effects of climate change, they illustrate the negative impact that industries have on small communities and showcase the importance of remote sensing and aerial photography as a way to track change over time in our communities and possibly help to draw attention to the growing crisis of our coastal communities.

Images copied from Google Earth Pro: 1990, 1998 and 2019 Link to the image from 1963: http://www.isledejeancharles.com/the-environment

The whole story: http://www.isledejeancharles.com/

I also used information from the following videos:
https://eros.usgs.gov/image-of-the-week/isle-de-jean-charles-louisiana
https://www.pbs.org/newshour/show/native-community-louisiana-relocates-land-washes-away
https://www.globalonenessproject.org/library/films/isle-de-jean-charles


Monday, July 1, 2019

Image of the day "Soviet missile launch site during Cuban Missile Crisis "


This is a low altitude image taken by U-2 reconnaissance plane during Cuban Missile Crisis in October 23, 1962. The image showed several detail of missile launch facility that Soviet Union secretly constructed in Cuban. All suspected features are labeled . vehicle trails were clearly visible in the whole image, several vehicles also exist near the trails. These features indicated the area had heavy traffic recently, and these vehicles were support vehicles for the launch site . The long tent structure is uncommon compare to tents for barracks. The intelligent analyst suspected this was a tent use to protect missile. The information given by this and other images made EXCOMM ( Executive Committee of the National Security Council) assume Soviet missiles were becoming real threat.


https://www.theatlantic.com/photo/2012/10/50-years-ago-the-cuban-missile-crisis/100387/

Sunday, June 30, 2019

Wildebeest Migration in the Serengeti Region - Image of the day, July 1st 2019


This image was taken using a GeoEye-1 satellite with a 0.5 m resolution sensor. No date is given as to when the image was captured but the image was taken in Kenya. The purpose of the image is to observe wildebeest migration. Although the image source does not specify when the migration occurs, it is well known that wildebeest migration usually occurs between June and October. However, this migration period is not definitive because seasons change may affect it. A great number of wildebeest leaves the Serengeti region of Tanzania when the rainy season ends and plains have dried out. During that period of time, the wildebeest herd crosses the Masai Mara river in Kenya and stays until October, at which point it crosses the river again to return to the Serengeti region. The image might be important to monitor wildebeest population growth or decline over time and it is also important to observe grazing patterns during this migration.

Image Source:
https://www.satimagingcorp.com/applications/environmental-impact-studies/wildlife-and-marine-conservation/wildlife-monitoring/


Image of the day, June 30, 2019: Water Shortage in India


    This pair of satellite images were taken by NASA's EO-1 respectively on May 31, 2018 and June 19, 2019 to compare the conditions of reservoirs in Chennai, the sixth largest city of India. Basically, critical drought attached most parts of India, about 2/3 of reservoirs are getting drier due to the less amount of precipitation, heatwaves, and water management. The Red Hill Lake (central above) is becoming smaller and shallower than one year ago, the same phenomenon occurs on most visible reservoirs in the city. From a macro view, this image set indicates how climate change worsen water shortage in tropical countries such as India; on the other side, it also provides reliable data by satellite to help relative departments make possible solutions.

Wednesday, June 26, 2019

Chernobyl Nuclear Power Plant, week of July 1st

This image (2016) displays the Chernobyl Nuclear Power Plant, 30 years after the nuclear disaster of 1986. The facility at the center of the image is the power plant itself, and the reflective cylindrical figure is the New Safe Confinement encasing reactor No. 4, the site of the core explosion that spewed high levels of radioactive and airborne isotopes into the surrounding land and atmosphere. The purpose of this was to halt the release of contaminants into the environment for nuclear decommissioning. Manmade channels run through the facility originating from a large lake that once served as a cooling pond for reactor-related activities. Agricultural plots are discernible along the plant’s outskirts, and although they have since been abandoned, vegetation continues to grow densely. It is interesting to see how flora and fauna have thrived here following nuclear contamination. Recent studies found that wildlife flourished in the exclusion zone; it was thought that the accident would leave surrounding areas devoid of significant wildlife for many decades. However, in only three decades it has become a refuge for brown bears, bison, wolves, lynxes, Przewalski horses, and 200+ bird species.


Tuesday, June 25, 2019

Image of the Day June 24, 2019

It seemed perfect that this was the Image of the Day from June 24, 2018 on the NASA Earth Observatory website. 
This is a daylight true color image and a thermal image taken 3 weeks after the eruption of Volcan de Fuego in Guatamala. Images were taken using Landsat 8. Scientists are studying this imagery for a number of reasons, including ongoing learning about the behavior of volcanoes and lahars, and the potential for disaster response during night time events. However, as the article points out, the nighttime response would be limited to a satellite being in the correct position with the correct weather conditions, so is not a system that could be relied on as a primary source of information. 

Link the the article:

Monday, June 24, 2019

Remote Sensing Can Measure Volcanoes Grow and Shrink

The image shows subtle expansion of Kilauea, which implies that magma is applying pressure from underneath. The image has concentric rings of color to show whether the volcano's radial movement is toward or away from the sensor and by how much, with three distinct rings equating to three half-wavelengths of 1.65 cm for a movement of 4.95 cm over nearly two months. This kind of information is especially important in places like Hawaii and places on the Pacific ring of fire, like Japan and Indonesia, where people live by volcanoes. 

As for the interferometry, I was displeased with the article's explanation for it so I like the way the following site describes it. Basically, two beams of light traveling the same distance through the same medium should be moving at the same speed. Therefore, the return signals, or lack thereof when a single beam is split and sent in two different directions before coming back and effectively neutralizing each other's waves, should arrive to a sensor at the same time. However, when something causes a beam to slow down, then the difference can be recorded.

Sunday, June 23, 2019

Image of the Day 6/24/19: South Korean Seaweed Aquaculture


This image was taken on January 31, 2014 and displays seaweed fields along the southern coast of South Korea. Seaweed is grown along this coast through aquaculture farming techniques and contributes to 90% of South Korea’s total seaweed crop. The seaweed in this farm is grown on ropes held close to the surface by buoys, allowing for sufficient sunlight during changing tides. This rope technique also accounts for the straight sections of seaweed crop displayed as dark squares in the image. Additionally, the seaweed’s ability to grow in these coastal waters means these aquaculture farms do not require fresh water or fertilizer; making them more sustainable than land-based farms. Most aquaculture in the United States consists of fish production, so this satellite image presents a unique view of vegetative aquaculture methods uncommon to our agricultural practices.